Bua Gomutputra | September 2026 | Project 3
Are “Healthy” Breakfast Cereals Actually Healthy?
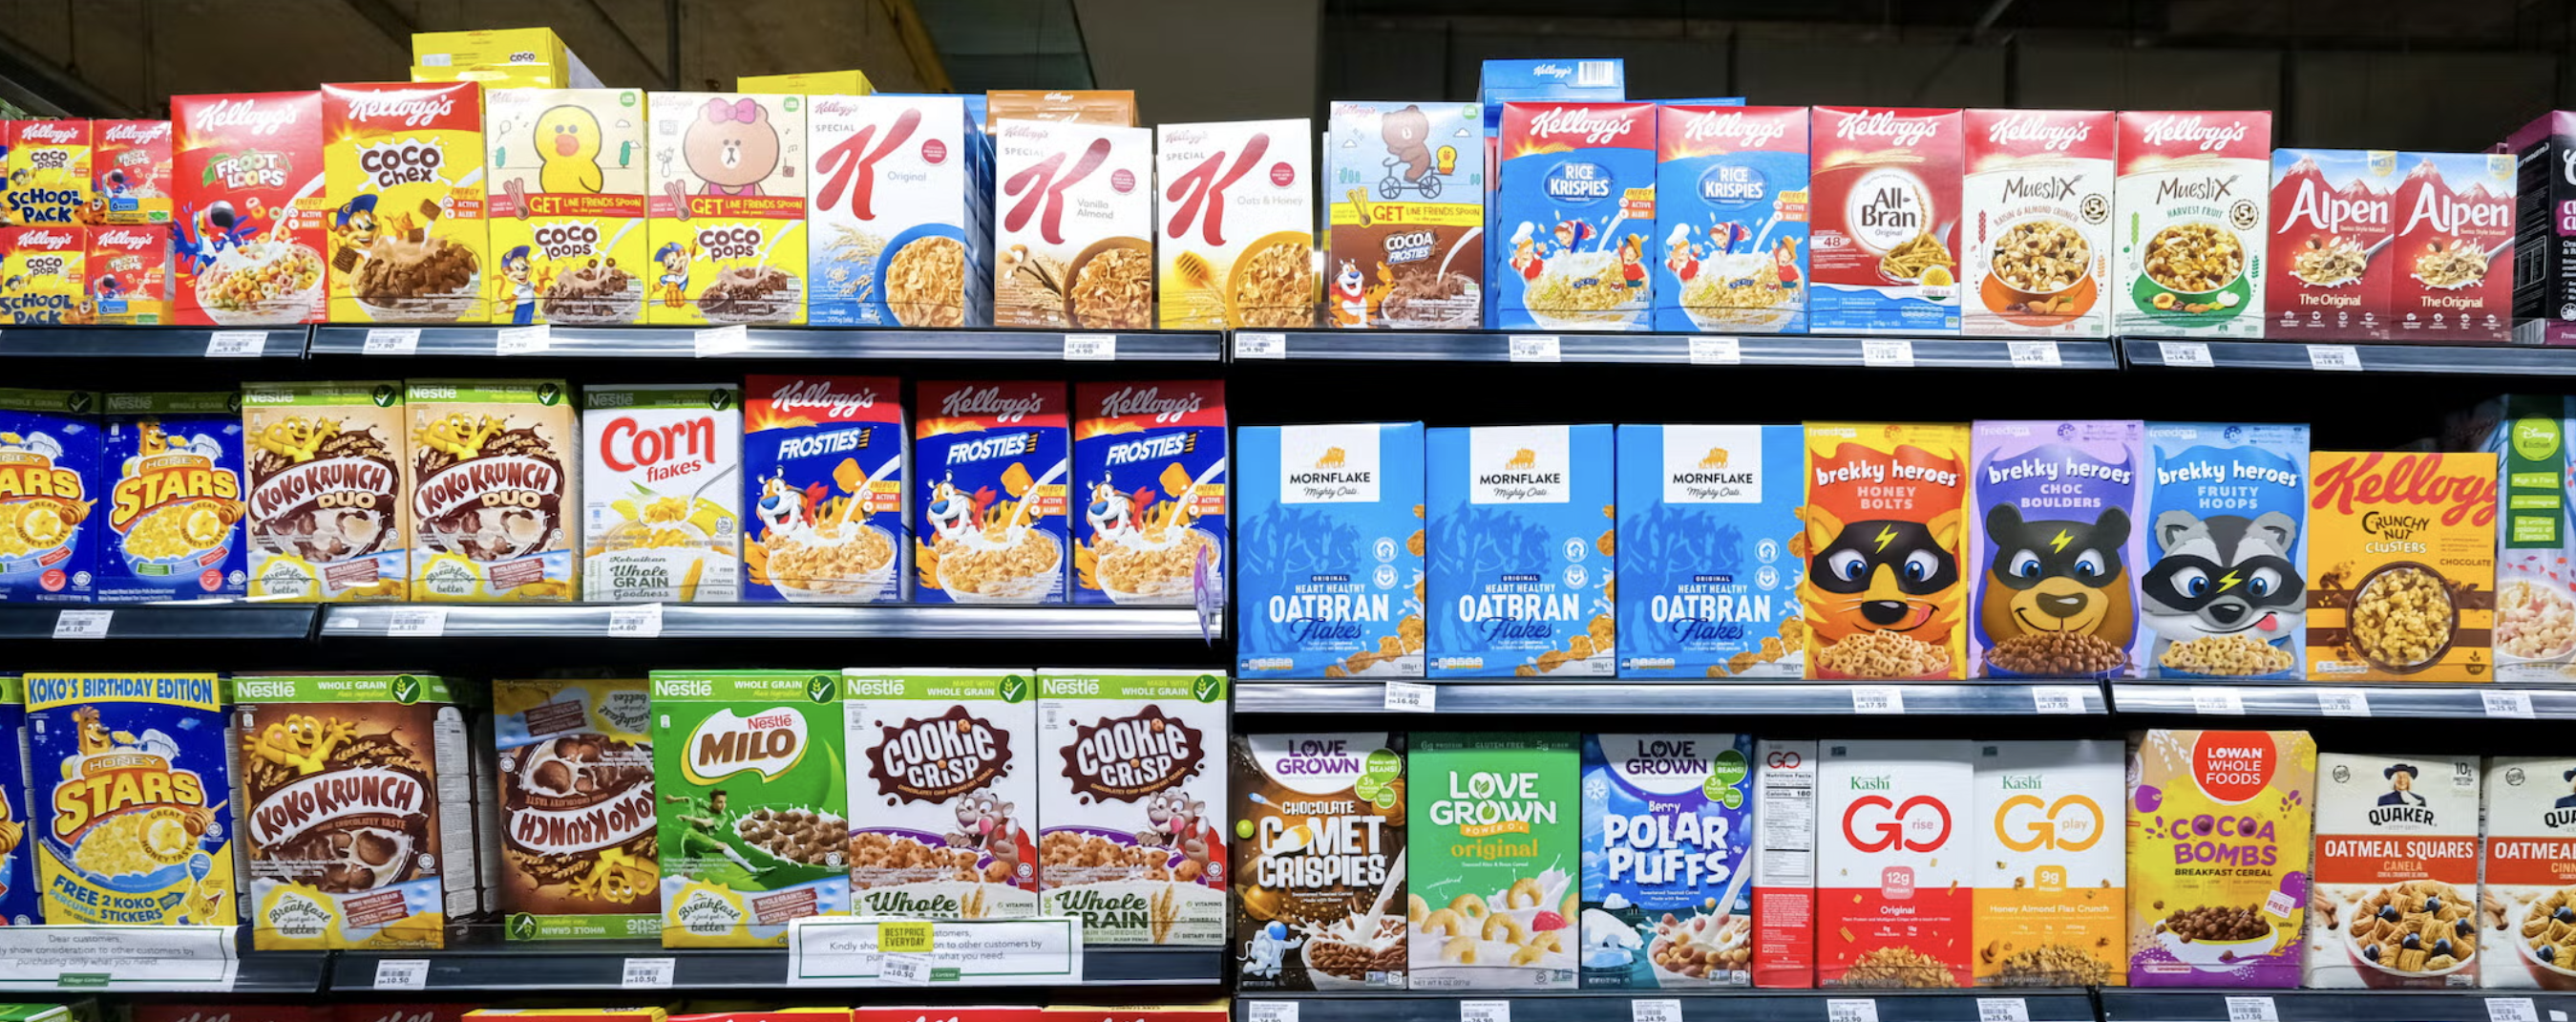
What is Breakfast Cereal...
“A type of food made from a cereal plant and commonly eaten at breakfast.” — Collins English Dictionary
How is it made?
- Processing: The grains are usually processed into fine flour and cooked.
- Mixing: The flour is then mixed with ingredients like sugar, cocoa, and water.
- Extrusion: Many breakfast cereals are produced via extrusion, a high-temperature process that uses a machine to shape the cereal.
- Drying: Next, the cereal is dried.
- Shaping: Finally, the cereal is shaped into forms, such as balls, stars, loops or rectangles.
Although many cereals begin with similar ingredients, their final nutritional profiles can vary significantly. Two cereals with comparable calorie counts may contain very different amounts of sugar, fiber, protein and sodium.
Why Should You Care?
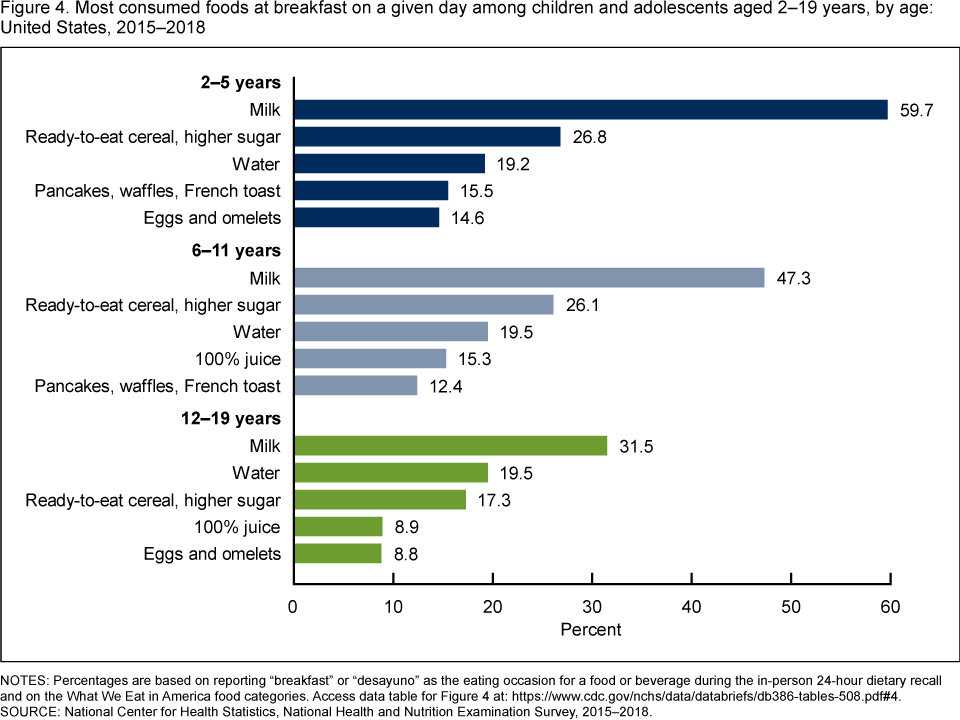
Breakfast cereal is a regular part of many diets. More than one-quarter of children and adolescents in America eat ready-to-eat cereal most days, while around half of adults eat it at least once or twice a week. Familiar products such as Cheerios, Frosted Flakes, Froot Loops and Lucky Charms remain household staples.
The graph from National Center for Health Statistics shows that milk alongside ready-to-eat cereal consistently ranks the highest amongst 2 to 19 year olds.
Cereals are often promoted as “heart healthy,” “high in vitamins” or “made with whole grains,” creating the impression that they are nutritious. However, Harvard Health Publishing explains that these claims may not reflect a cereal’s complete nutritional profile. A fortified cereal, for example, may still contain high levels of sugar or sodium.
This page helps consumers look beyond packaging by comparing the calories, sugar, fiber, protein and sodium in 77 cereals. Users can examine nutritional tradeoffs, compare familiar products and make more informed breakfast choices.
| Name
- The cereal's name. Click a name below to see its nutritional summary.
|
Calories
- Energy per serving. Compare serving sizes when comparing cereals.
|
Protein
Grams of protein per serving.
|
Fat
Grams of fat per serving.
|
Sodium
Milligrams of sodium per serving.
|
Fiber
Grams of dietary fiber per serving.
|
Sugars
Grams of sugar per serving.
|
Rating
- The dataset's score for this cereal. Higher scores indicate a higher rating.
|
|---|---|---|---|---|---|---|---|
| 100% Bran | 70 | 4 | 1 | 130 | 10 | 6 | 68.402973 |
| 100% Natural Bran | 120 | 3 | 5 | 15 | 2 | 8 | 33.983679 |
| All-Bran | 70 | 4 | 1 | 260 | 9 | 5 | 59.425505 |
| All-Bran with Extra Fiber | 50 | 4 | 0 | 140 | 14 | 0 | 93.704912 |
| Almond Delight | 110 | 2 | 2 | 200 | 1 | 8 | 34.384843 |
| Apple Cinnamon Cheerios | 110 | 2 | 2 | 180 | 1.5 | 10 | 29.509541 |
| Apple Jacks | 110 | 2 | 0 | 125 | 1 | 14 | 33.174094 |
| Basic 4 | 130 | 3 | 2 | 210 | 2 | 8 | 37.038562 |
| Bran Chex | 90 | 2 | 1 | 200 | 4 | 6 | 49.120253 |
| Bran Flakes | 90 | 3 | 0 | 210 | 5 | 5 | 53.313813 |
| Cap'n'Crunch | 120 | 1 | 2 | 220 | 0 | 12 | 18.042851 |
| Cheerios | 110 | 6 | 2 | 290 | 2 | 1 | 50.764999 |
| Cinnamon Toast Crunch | 120 | 1 | 3 | 210 | 0 | 9 | 19.823573 |
| Clusters | 110 | 3 | 2 | 140 | 2 | 7 | 40.400208 |
| Cocoa Puffs | 110 | 1 | 1 | 180 | 0 | 13 | 22.736446 |
| Corn Chex | 110 | 2 | 0 | 280 | 0 | 3 | 41.445019 |
| Corn Flakes | 100 | 2 | 0 | 290 | 1 | 2 | 45.863324 |
| Corn Pops | 110 | 1 | 0 | 90 | 1 | 12 | 35.782791 |
| Count Chocula | 110 | 1 | 1 | 180 | 0 | 13 | 22.396513 |
| Cracklin' Oat Bran | 110 | 3 | 3 | 140 | 4 | 7 | 40.448772 |
| Cream of Wheat (Quick) | 100 | 3 | 0 | 80 | 1 | 0 | 64.533816 |
| Crispix | 110 | 2 | 0 | 220 | 1 | 3 | 46.895644 |
| Crispy Wheat & Raisins | 100 | 2 | 1 | 140 | 2 | 10 | 36.176196 |
| Double Chex | 100 | 2 | 0 | 190 | 1 | 5 | 44.330856 |
| Froot Loops | 110 | 2 | 1 | 125 | 1 | 13 | 32.207582 |
| Frosted Flakes | 110 | 1 | 0 | 200 | 1 | 11 | 31.435973 |
| Frosted Mini-Wheats | 100 | 3 | 0 | 0 | 3 | 7 | 58.345141 |
| Fruit & Fibre Dates; Walnuts; and Oats | 120 | 3 | 2 | 160 | 5 | 10 | 40.917047 |
| Nutri-Grain Almond-Raisin | 140 | 3 | 2 | 220 | 3 | 7 | 40.69232 |
| Nutri-grain Wheat | 90 | 3 | 0 | 170 | 3 | 2 | 59.642837 |
| Oatmeal Raisin Crisp | 130 | 3 | 2 | 170 | 1.5 | 10 | 30.450843 |
| Post Nat. Raisin Bran | 120 | 3 | 1 | 200 | 6 | 14 | 37.840594 |
Press the headings to see definition!
A Closer Look at the Data
1. Same Calories, BUT Different Nutrition
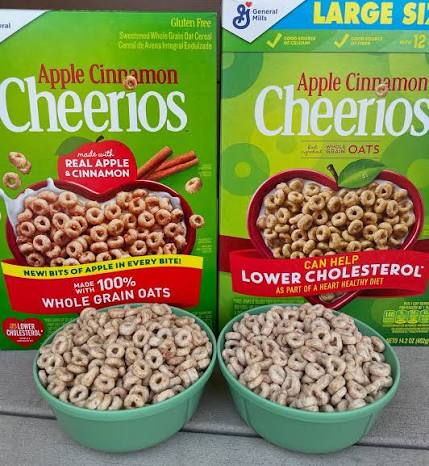
Cheerios and Apple Cinnamon Cheerios both contain 110 calories per serving, which may make them appear nutritionally similar. However, Apple Cinnamon Cheerios contains 10 grams of sugar, compared with only one gram in regular Cheerios. Regular Cheerios also provides six grams of protein; this is three times the amount in the flavored version.
Their ratings reflect this difference: Cheerios scored 50.8, while Apple Cinnamon Cheerios scored 29.5. This comparison demonstrates that two products with the same calorie count can offer very different nutritional value. Consumers should therefore consider what those calories contain, rather than relying on the number alone.
2. Does a Healthy Name Tell the Whole Story?
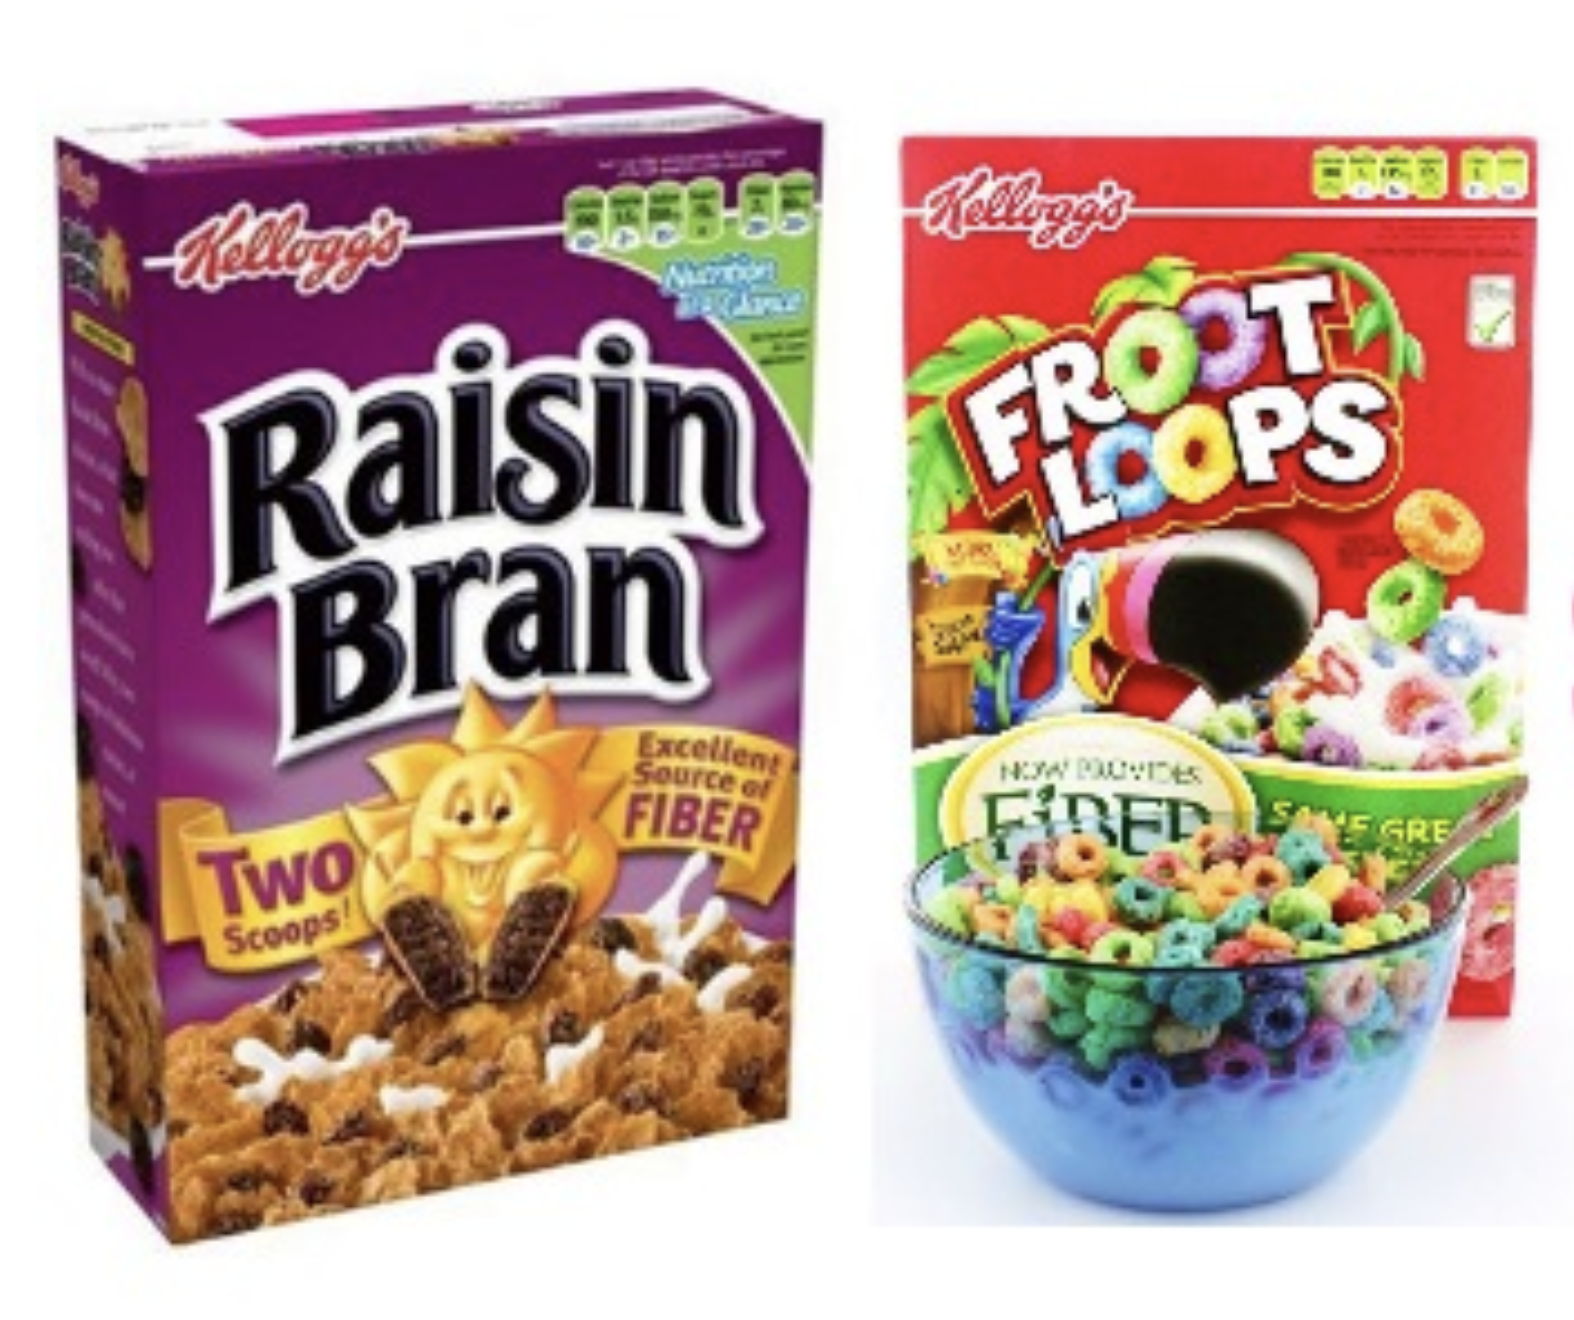
Raisin Bran may appear healthier than Froot Loops because its name emphasizes fruit and bran. However, it contains 12 grams of sugar per serving, only one gram less than Froot Loops, and has more sodium.
Still, Raisin Bran provides five grams of fiber and three grams of protein, compared with one gram of fiber and two grams of protein in Froot Loops. It also uses a larger listed serving size, which affects the direct comparison. These differences show that a cereal can contain valuable nutrients while also being relatively high in sugar or sodium. A healthy-sounding name does not provide enough information on its own.
3. The Best vs Worst Rated Cereal
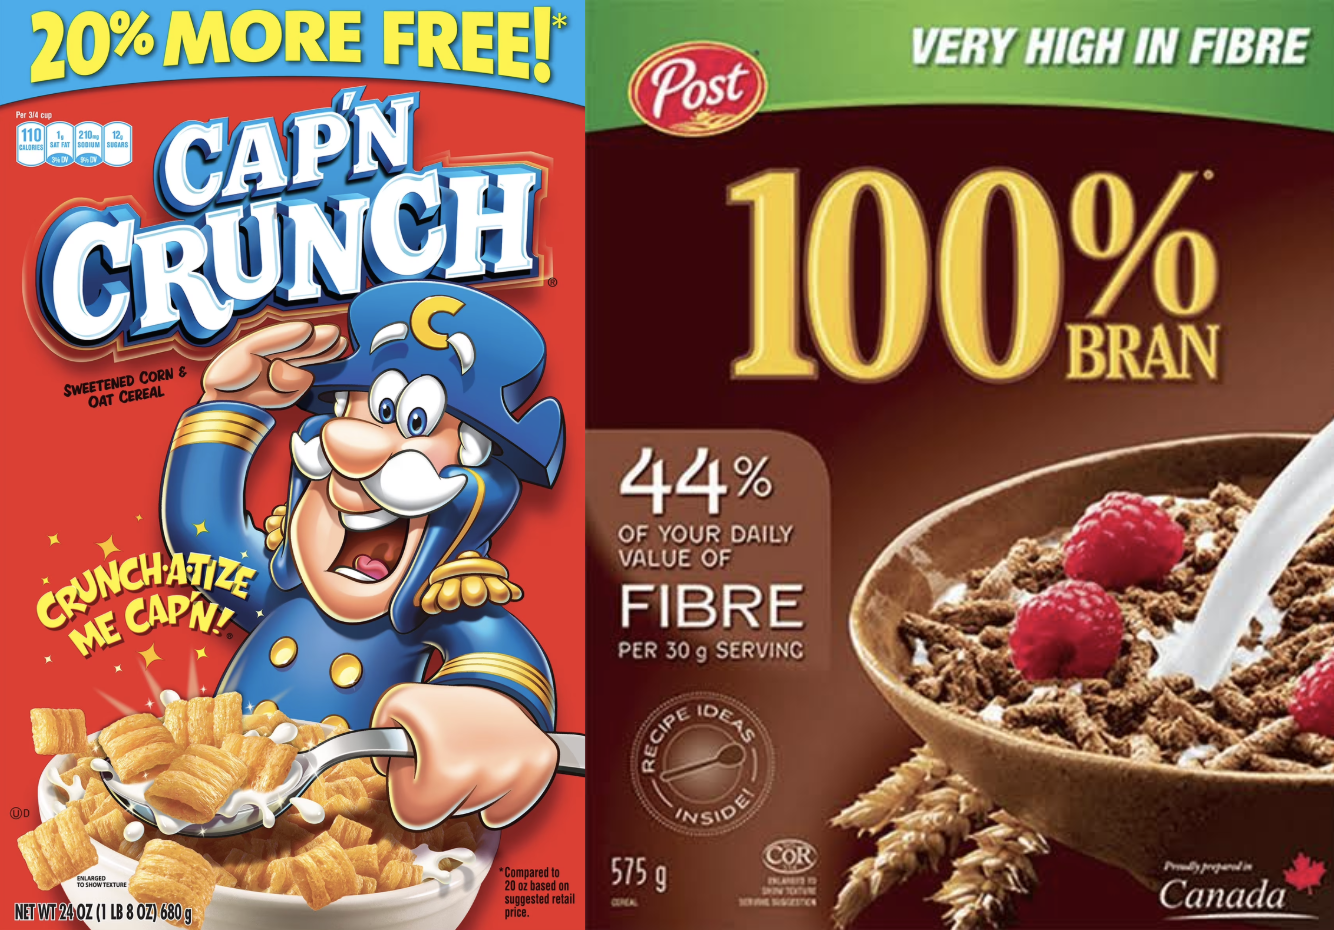
All-Bran with Extra Fiber received the highest rating in the dataset at 93.7. It contains 14 grams of fiber, four grams of protein and no sugar. In comparison, Cap’n Crunch received the lowest rating at 18.0, with 12 grams of sugar, no fiber and only one gram of protein.
All-Bran with Extra Fiber also contains 50 calories per serving, compared with 120 calories in Cap’n Crunch. The contrast between these cereals suggests that products with more fiber and protein and less sugar generally perform better in the dataset’s rating system. However, because the exact rating formula is not documented, the individual individual nutrient values provide the most transparent basis for comparison.
Together, these examples show that nutritional quality cannot be determined by calories, branding or a single health claim. Looking at sugar, fiber, protein, sodium and serving size together gives consumers a more complete picture.
Glossary of Key Terms
- 1. Serving Size
- The recommended amount of cereal used to calculate the nutritional information on its label.
- 2. Nutritional Profile
- A complete overview of a food’s nutrients, including its calories, sugar, fiber, protein, fat and sodium.
- 3. Dietary Fiber
- A type of carbohydrate that supports digestion and can help a person feel full for longer.
- 4. Fortification
- The process of adding vitamins and minerals to a food to increase its nutritional value.
- 5. Nutrient Density
- The amount of beneficial nutrients a food provides in relation to its calories.
- 6. Nutritional Rating
- A score used in this dataset to compare the nutritional characteristics of cereals. The exact formula used to calculate it is not documented.
Press a term for its definition!