Are Breakfast Cereals Actually Healthy?
Breakfast Cereals
(1) Are "Healthy" Breakfast Cereals Actually Healthy?
A cereal box does not tell the whole story. Calories and healthy-sounding names can hide important nutritional differences.
My Week 5 project compares 32 selected cereals from a dataset of 77. These examples examine sugar, fiber, protein and sodium.
The argument: compare several nutrients before judging a cereal. All values here are per listed serving; serving sizes may differ.
(2) Same Calories, Different Nutrition
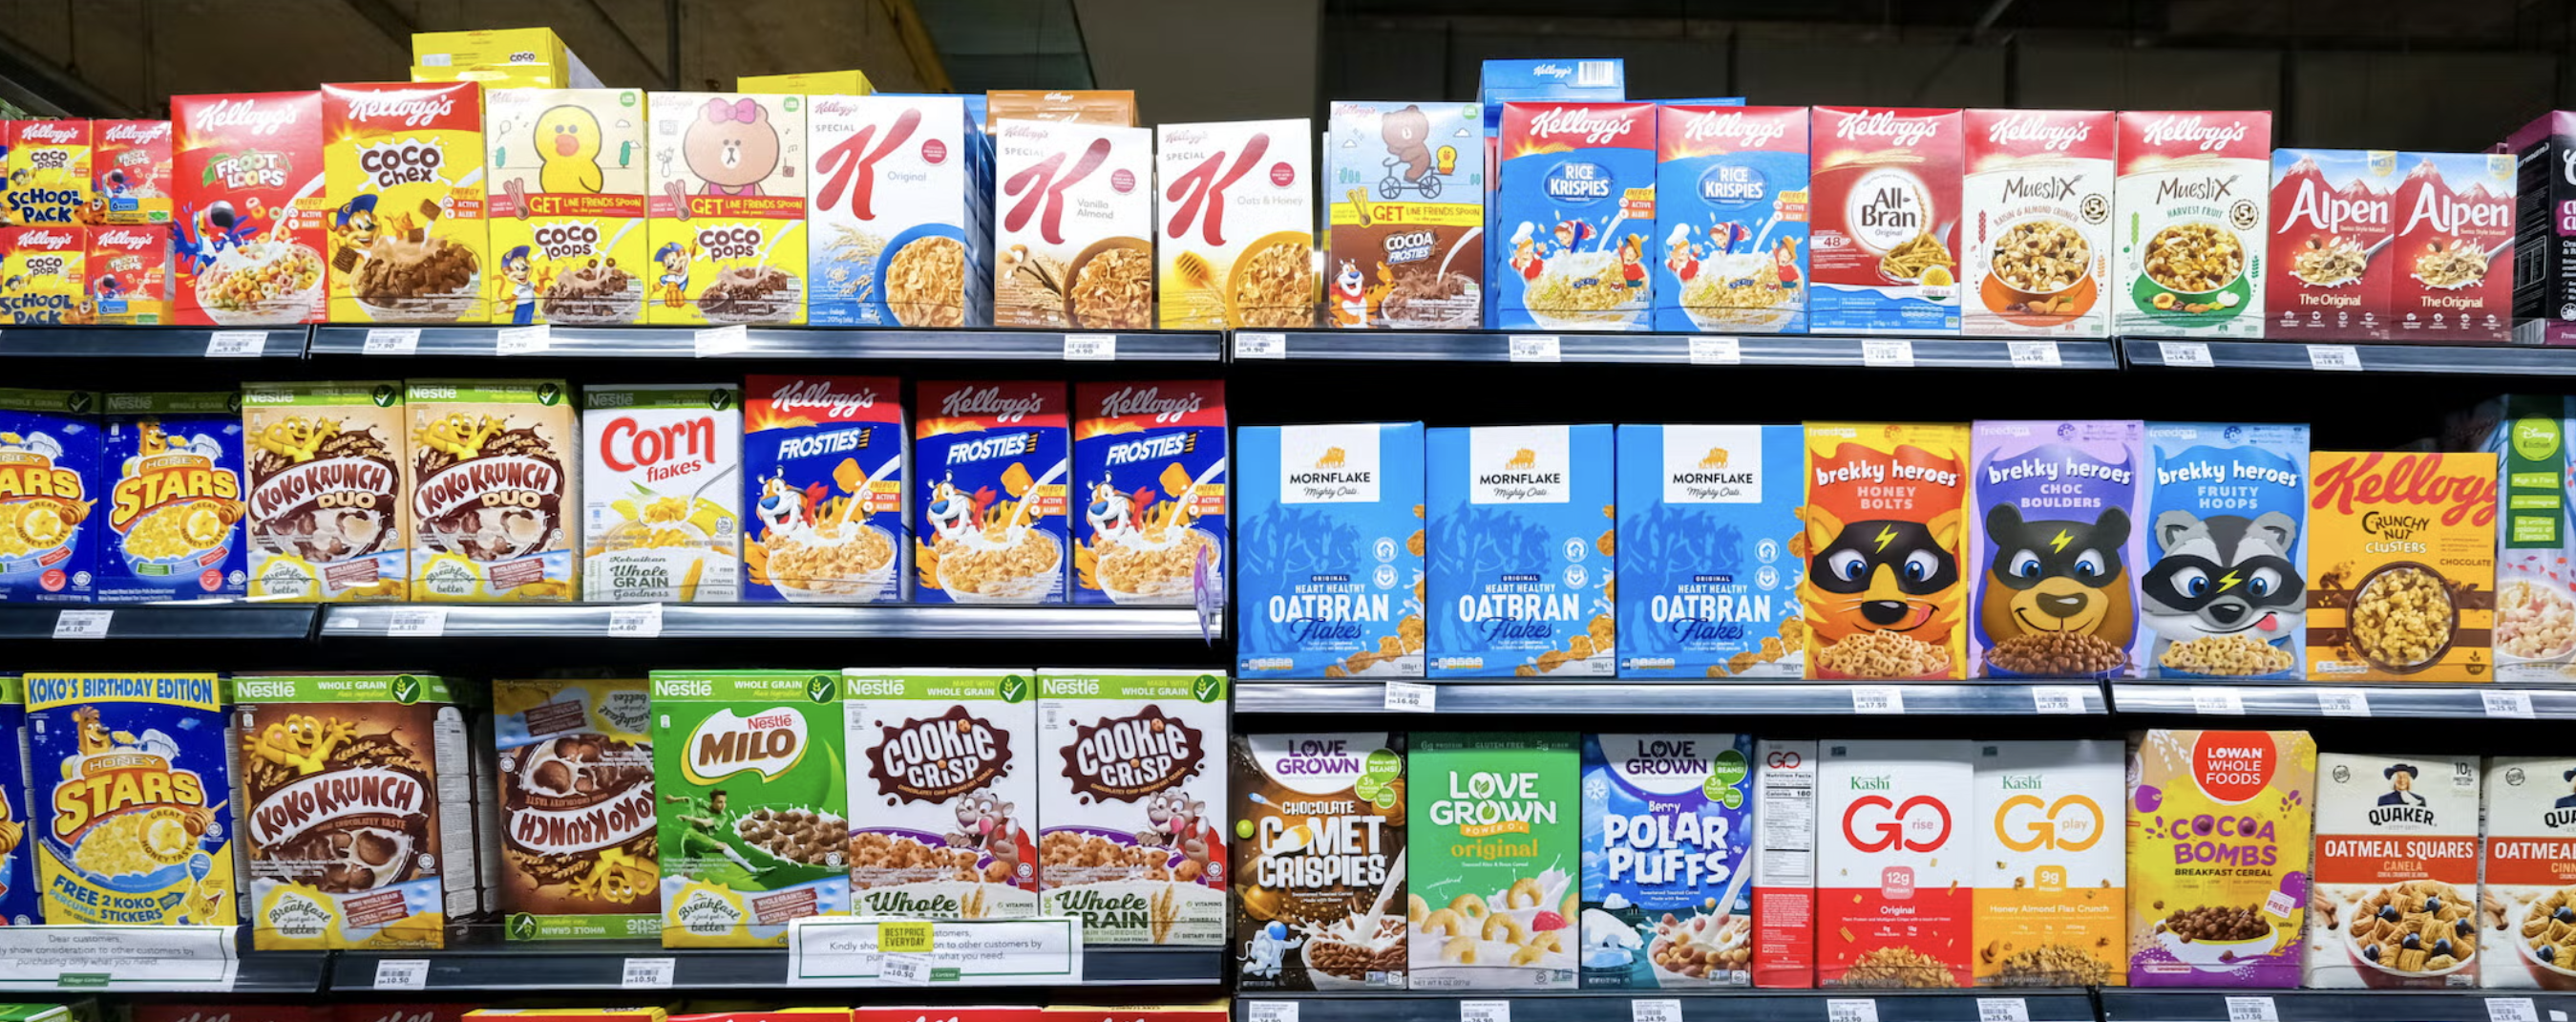
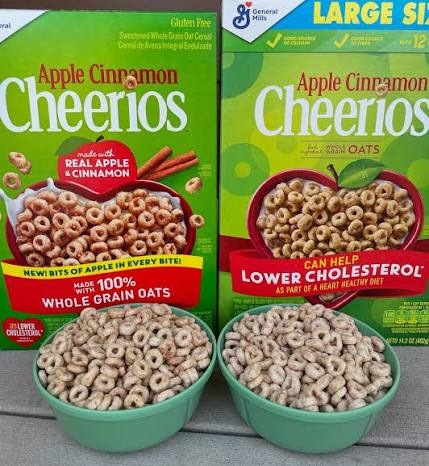
Cheerios and Apple Cinnamon Cheerios both have 110 calories per listed serving, but their other numbers differ.
Cheerios has 1 gram of sugar and 6 grams of protein. Apple Cinnamon Cheerios has 10 grams of sugar and 2 grams of protein.
Cheerios also has more sodium: 290 milligrams versus 180. Equal calories do not mean equal nutritional profiles.
(3) Does a Healthy Name Tell the Whole Story?
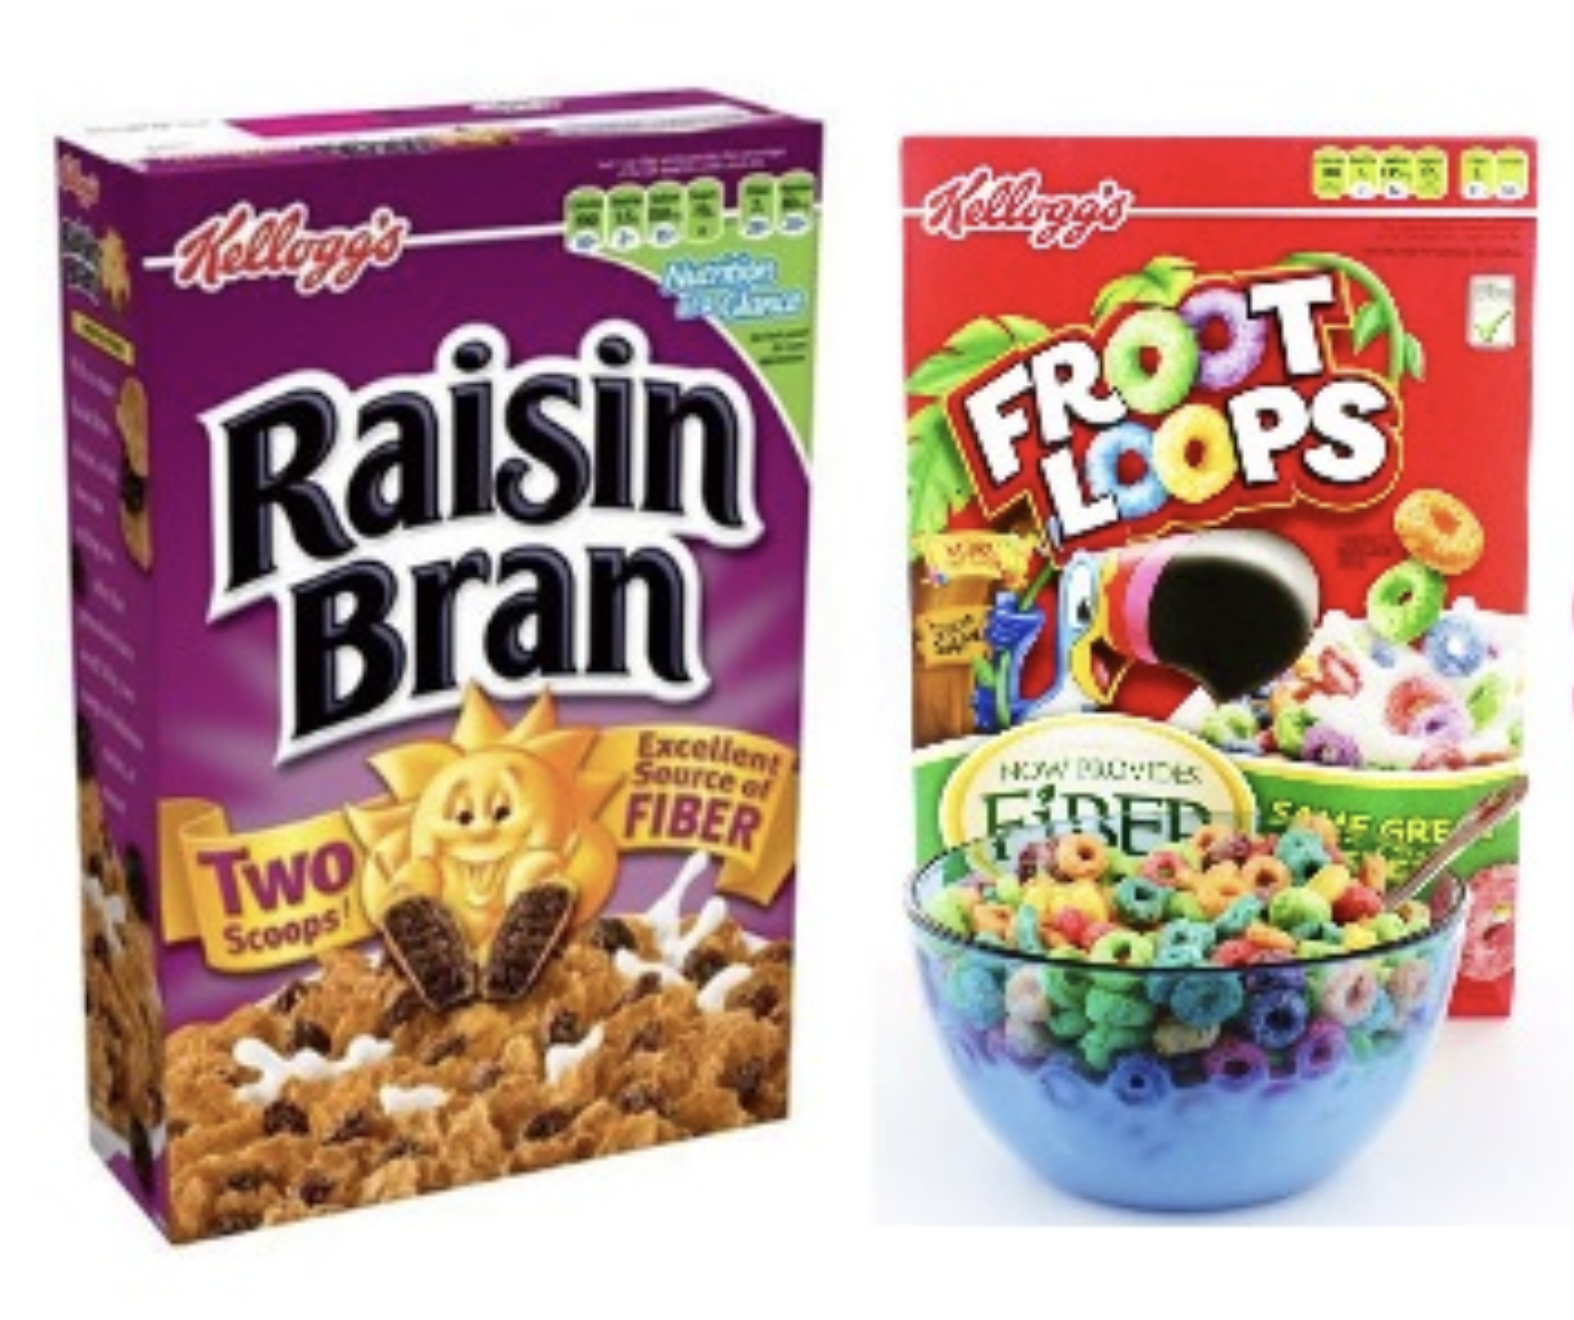
Post Nat. Raisin Bran has 14 grams of sugar per listed serving. Froot Loops has 13 grams.
However, Post Nat. Raisin Bran has 6 grams of fiber and 3 grams of protein. Froot Loops has 1 gram of fiber and 2 grams of protein.
Post Nat. Raisin Bran also has more sodium: 200 milligrams versus 125. A name alone cannot explain these tradeoffs.
(4) Look Beyond the Rating
All-Bran with Extra Fiber has the highest rating in my 32-cereal table: 93.7. It has 14 grams of fiber, 4 grams of protein and 0 grams of sugar.
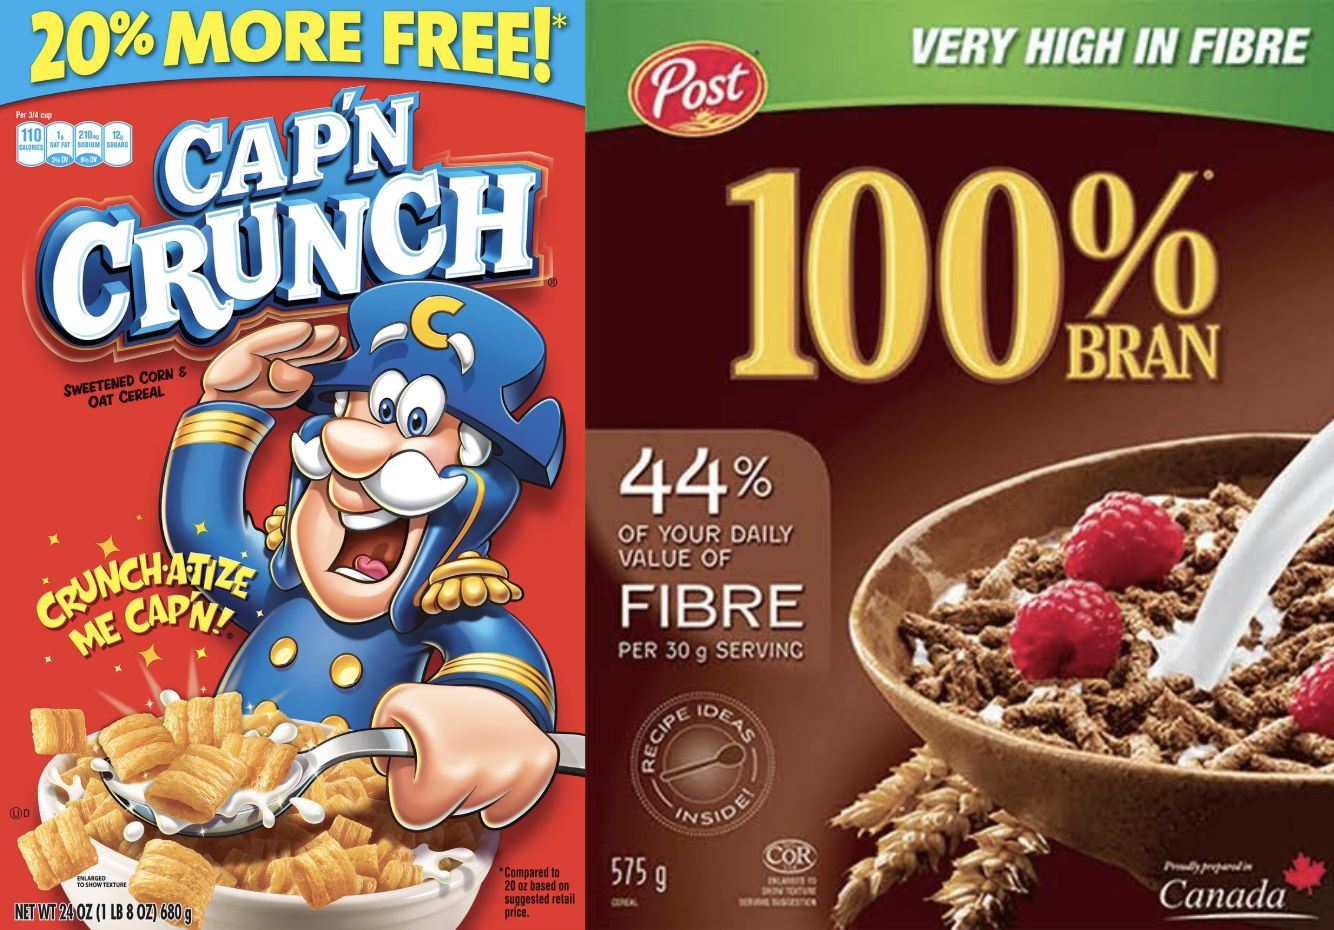
Cap'n Crunch has the lowest rating in this table: 18.0. It has 0 grams of fiber, 1 gram of protein and 12 grams of sugar.
These two examples show different nutrient profiles. Their scores alone do not explain how the dataset rating is calculated.
(5) Read the Whole Label
The Cheerios comparison shows why calories alone are not enough. The Raisin Bran comparison shows why names are not enough.
Compare sugar, fiber, protein and sodium together. Check serving sizes before comparing equal amounts of cereal.
Source: Carnegie Mellon University cereal dataset, as used in my Week 5 table. These dataset values may differ from current product labels.